A Developer's Guide to Static Analysis

Code reviews catch a lot. But they can't catch everything. I've reviewed pull requests that looked perfectly fine - clean logic, good naming, solid tests - only to discover weeks later that a query was vulnerable to injection, or a function was silently swallowing errors in an edge case no reviewer thought to check. That experience pushed my team to invest in static analysis tooling - not as a replacement for code review, but as the kind of tireless, pattern-matching second pair of eyes that catches what we overlook.
Static analysis reads your source code without running it, looking for patterns that humans tend to miss: security vulnerabilities, subtle bugs, code that works today but will break when someone changes an assumption tomorrow.
The industry calls this SAST - Static Application Security Testing. But the name undersells it. Modern static analysis tools go well beyond security. They flag complexity, duplication, maintainability issues, and coding standards violations. If you've used SonarQube, Semgrep, CodeQL, or even the linting rules in your IDE, you've already been using static analysis. This post is about understanding what these tools actually do under the hood, where they fall short, and how to make them genuinely useful rather than just another source of noise.
What Static Analysis Actually Does
At its core, static analysis examines code without executing it. A human reviewing code does something similar - they read through the logic and try to spot problems. Static analysis tools automate this, but they do it differently. Instead of reading code like text, they parse it into structured representations that make patterns easier to detect.
What is an AST?
An Abstract Syntax Tree is a concept borrowed from compilers. When a compiler translates source code into machine code, its first step is parsing the text into a tree that represents the program's structure - stripping away whitespace, comments, and formatting to leave just the logical relationships between expressions, statements, and declarations. SAST tools reuse this same compilation technique, but instead of generating machine code, they walk the tree looking for patterns that indicate bugs or vulnerabilities.
Here's the process, step by step:
- Parse the code and build an AST. The tool converts source code into an Abstract Syntax Tree - a tree structure that represents the syntactic structure of the code. Variables, operations, function calls, and control flow all become nodes in this tree. This strips away formatting and comments, leaving just the logical structure.
- Perform data flow analysis. The tool traces how data moves through the program. Where does user input enter? Does it pass through sanitization before reaching a database query? Data flow analysis connects the dots between where data originates and where it ends up.
- Apply rules. The tool matches patterns in the AST and data flow against a configurable set of rules. These rules encode known bad patterns - unsanitized input in SQL queries, unchecked null references, hardcoded credentials, overly complex methods.
- Report findings. Each match produces a finding with the vulnerability type, file location, severity, and usually remediation advice.
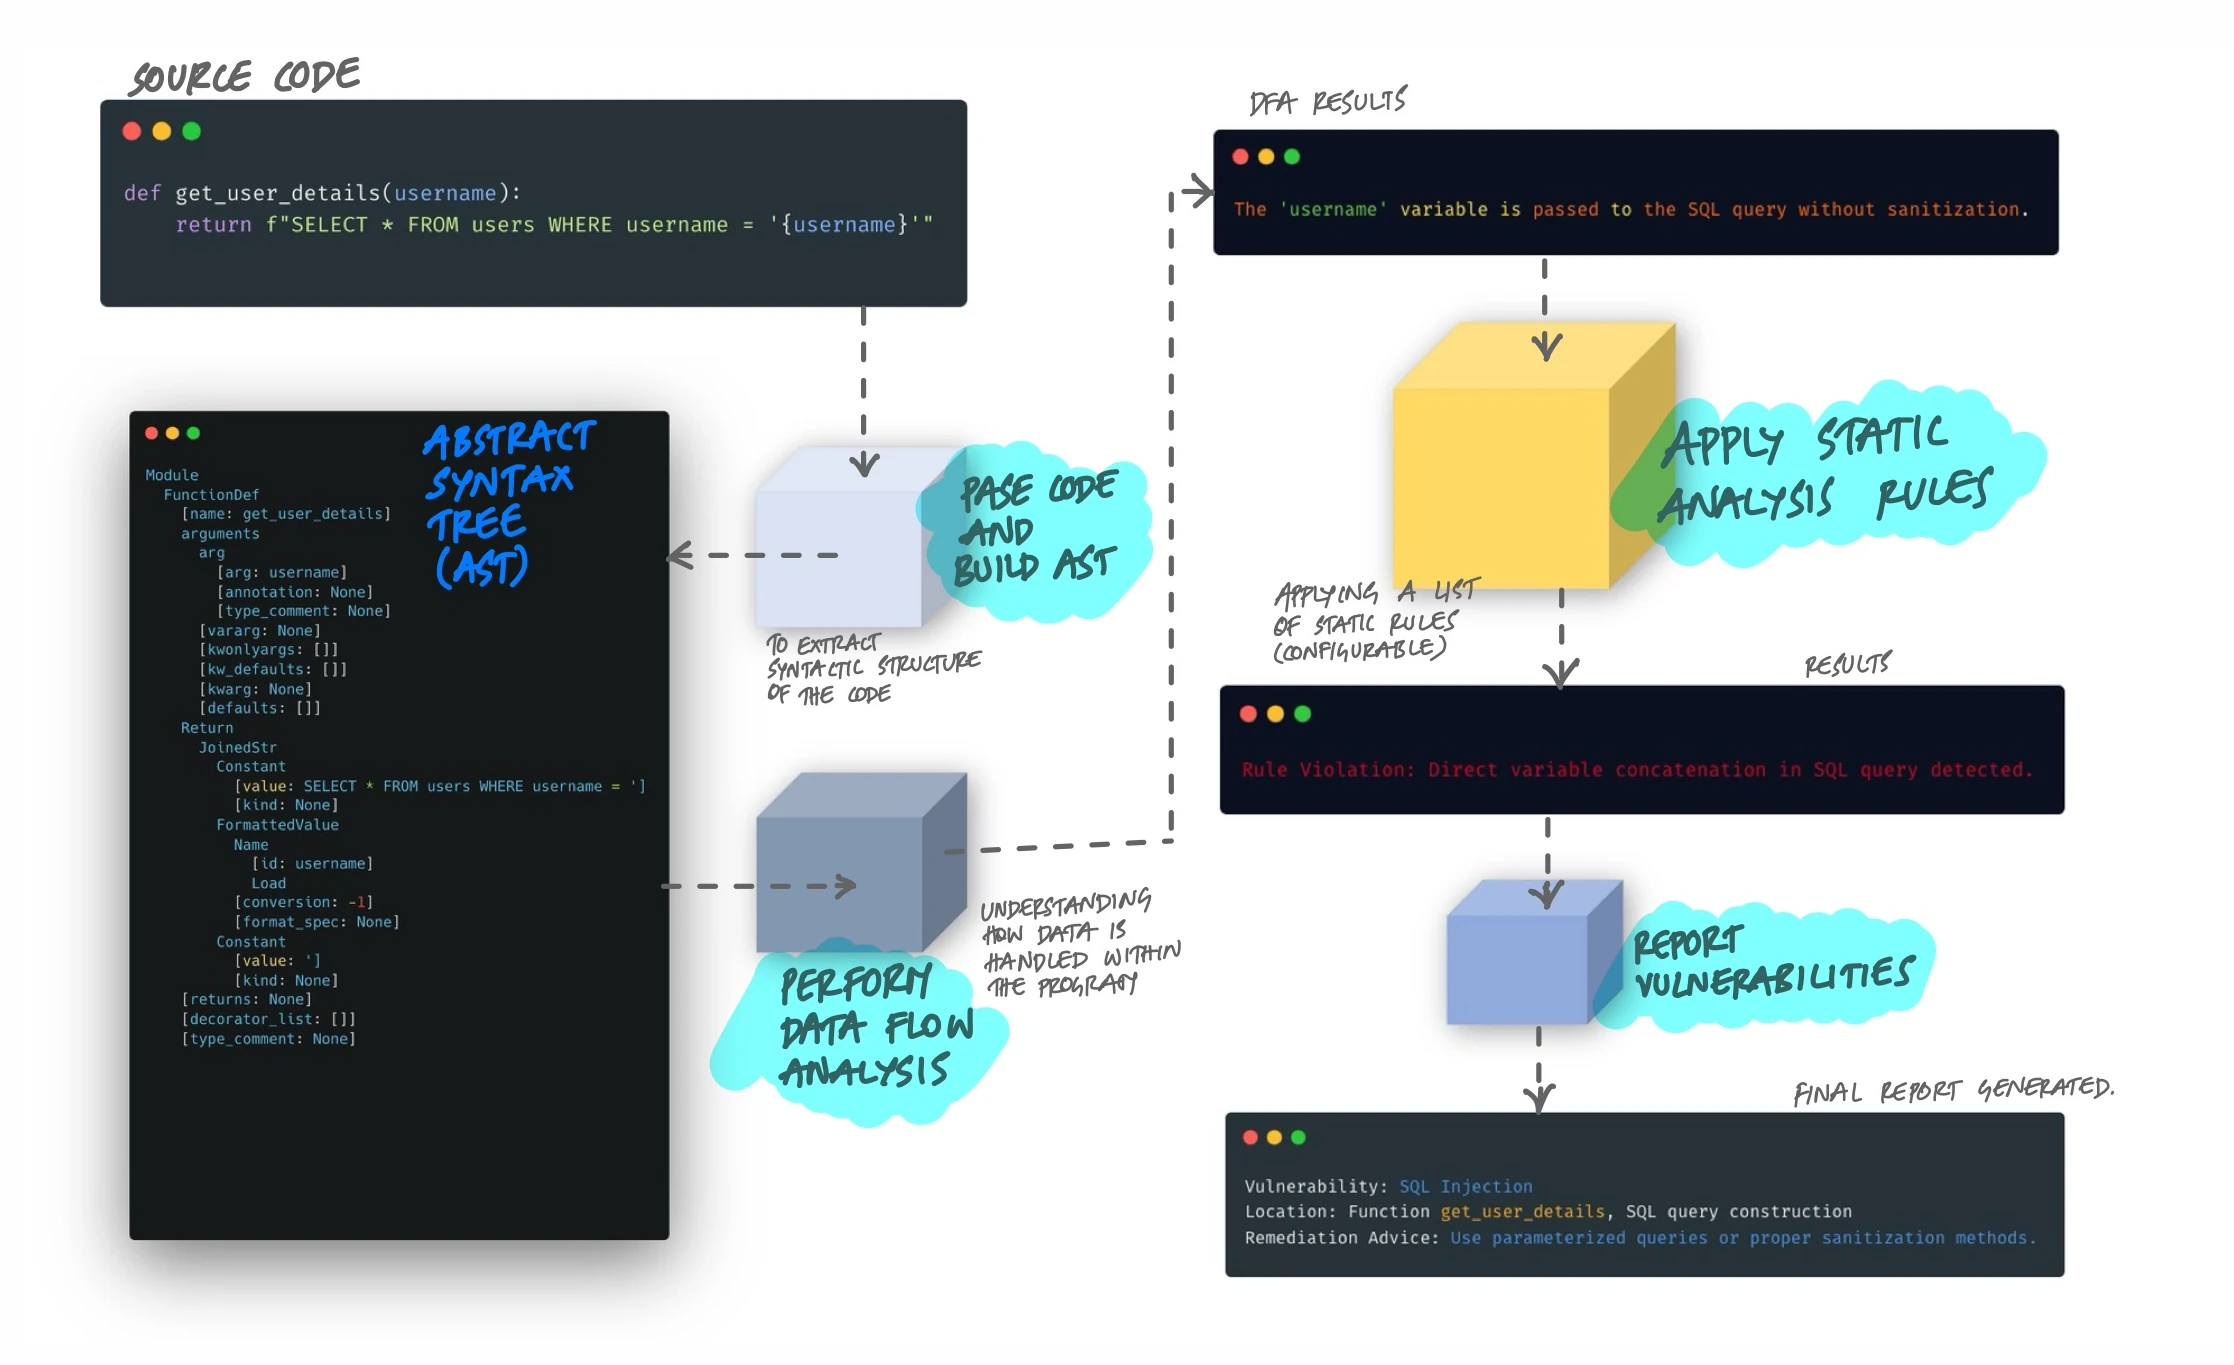
Take a concrete example. A Python function like return f"SELECT * FROM users WHERE username = '{username}'" would trigger a SQL injection finding. The tool sees user input (username) flowing directly into a SQL query string without parameterization. It doesn't need to run the code to know this is dangerous - the pattern in the AST is enough.
The Representations That Make It Work
The AST is just one of several intermediate representations that tools use. Different representations reveal different kinds of problems:
- Abstract Syntax Tree (AST): Captures the syntactic structure. Good for finding pattern-based issues like use of deprecated APIs or insecure function calls.
- Control Flow Graph (CFG): Maps all possible execution paths through the code. Reveals unreachable code, infinite loops, and missing error handling branches.
- Data Flow Graph: Tracks how values propagate through variables and function calls. Essential for taint analysis - following untrusted data from source to sink.
- Call Graph: Shows which functions call which other functions. Helps detect issues that span multiple function boundaries, like a sanitization function that's defined but never actually called on the right path.
Most modern tools combine multiple representations. A SQL injection check, for example, uses data flow analysis to trace the input through the call graph, then checks the AST at the point where the query is constructed to see if parameterization is used.
Where Static Analysis Fits in the Pipeline
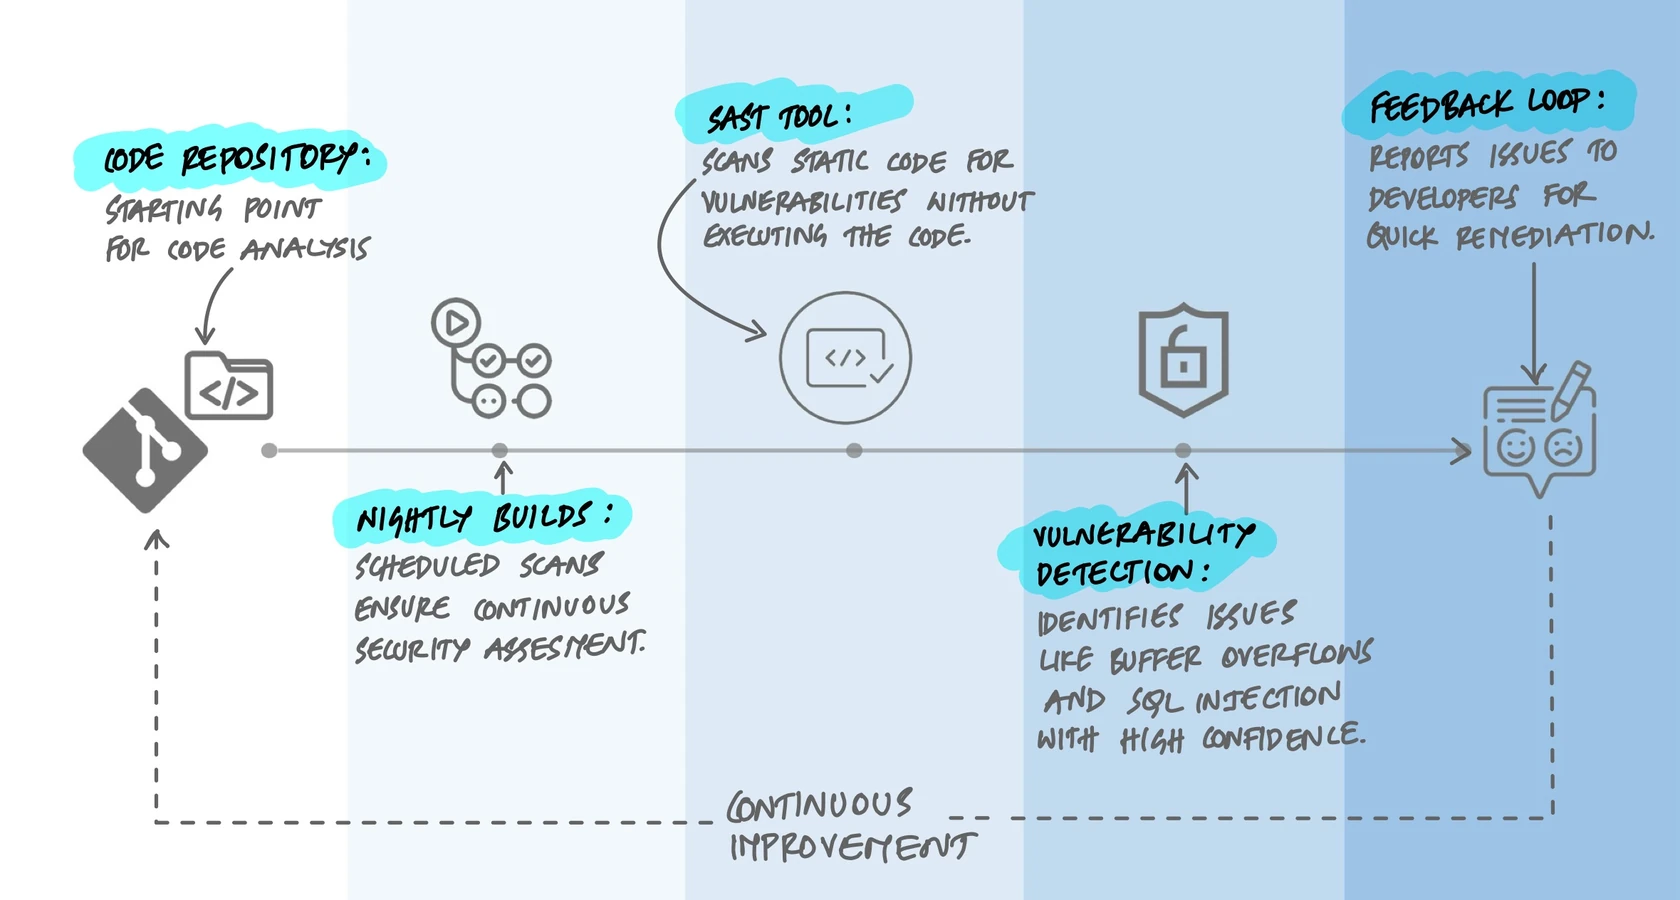
Static analysis is most valuable when it runs automatically and gives feedback fast. There are three common integration points:
- In the IDE. Tools like SonarLint, Semgrep, and ESLint run as you type, highlighting issues before you even commit. This is the tightest feedback loop - you see the problem while you still have full context.
- In CI/CD. The tool scans every pull request or commit. Findings can block merges if they exceed a threshold (a "quality gate"). This catches what IDE checks miss and enforces team-wide standards.
- Scheduled scans. Full codebase scans run nightly or weekly, catching issues in code that wasn't changed recently but may have become vulnerable due to updated rules or newly disclosed patterns.
The key insight is that static analysis doesn't replace other testing - it complements it. It catches a specific class of problems (pattern-based, structural, data-flow-based) very well, but it can't catch everything.
SAST, DAST, and IAST: What Each One Catches
Static analysis is one of three main approaches to automated security testing, and understanding the differences matters because they find fundamentally different types of bugs.
SAST (Static Application Security Testing) reads source code without running it. It's great at finding injection flaws, hardcoded secrets, insecure cryptographic usage, and code-level vulnerabilities. It runs early in development and covers all code paths, including dead code. But it can't see runtime behavior - it doesn't know what your authentication flow actually does when a user submits a request.
DAST (Dynamic Application Security Testing) tests the running application from the outside, like an attacker would. Tools like OWASP ZAP or Burp Suite send crafted HTTP requests to your APIs and web endpoints, then observe the responses for signs of vulnerabilities. DAST finds misconfigured headers, exposed endpoints, authentication bypasses, and runtime injection flaws. But it only tests the API routes and pages it actually hits - it can't see code behind endpoints it doesn't reach.
IAST (Interactive Application Security Testing) instruments the running application from the inside. It combines aspects of both - it sees the source code context and the runtime behavior simultaneously. Tools like Contrast Security can trace a tainted input from the HTTP request all the way through the code to a database call, with full stack traces. The tradeoff is complexity: IAST requires agents running inside your application.
Most mature teams use SAST and DAST together. SAST in the CI pipeline for every commit, DAST against staging environments on a regular schedule. IAST is less common but valuable for applications with complex data flows where SAST alone produces too many false positives.
The False Positive Problem
Here's the reality that every team eventually faces: static analysis tools are noisy. A tool scanning a typical codebase will produce findings that range from genuine critical vulnerabilities to complete non-issues. And if developers learn to ignore the noise, they'll ignore the real findings too.
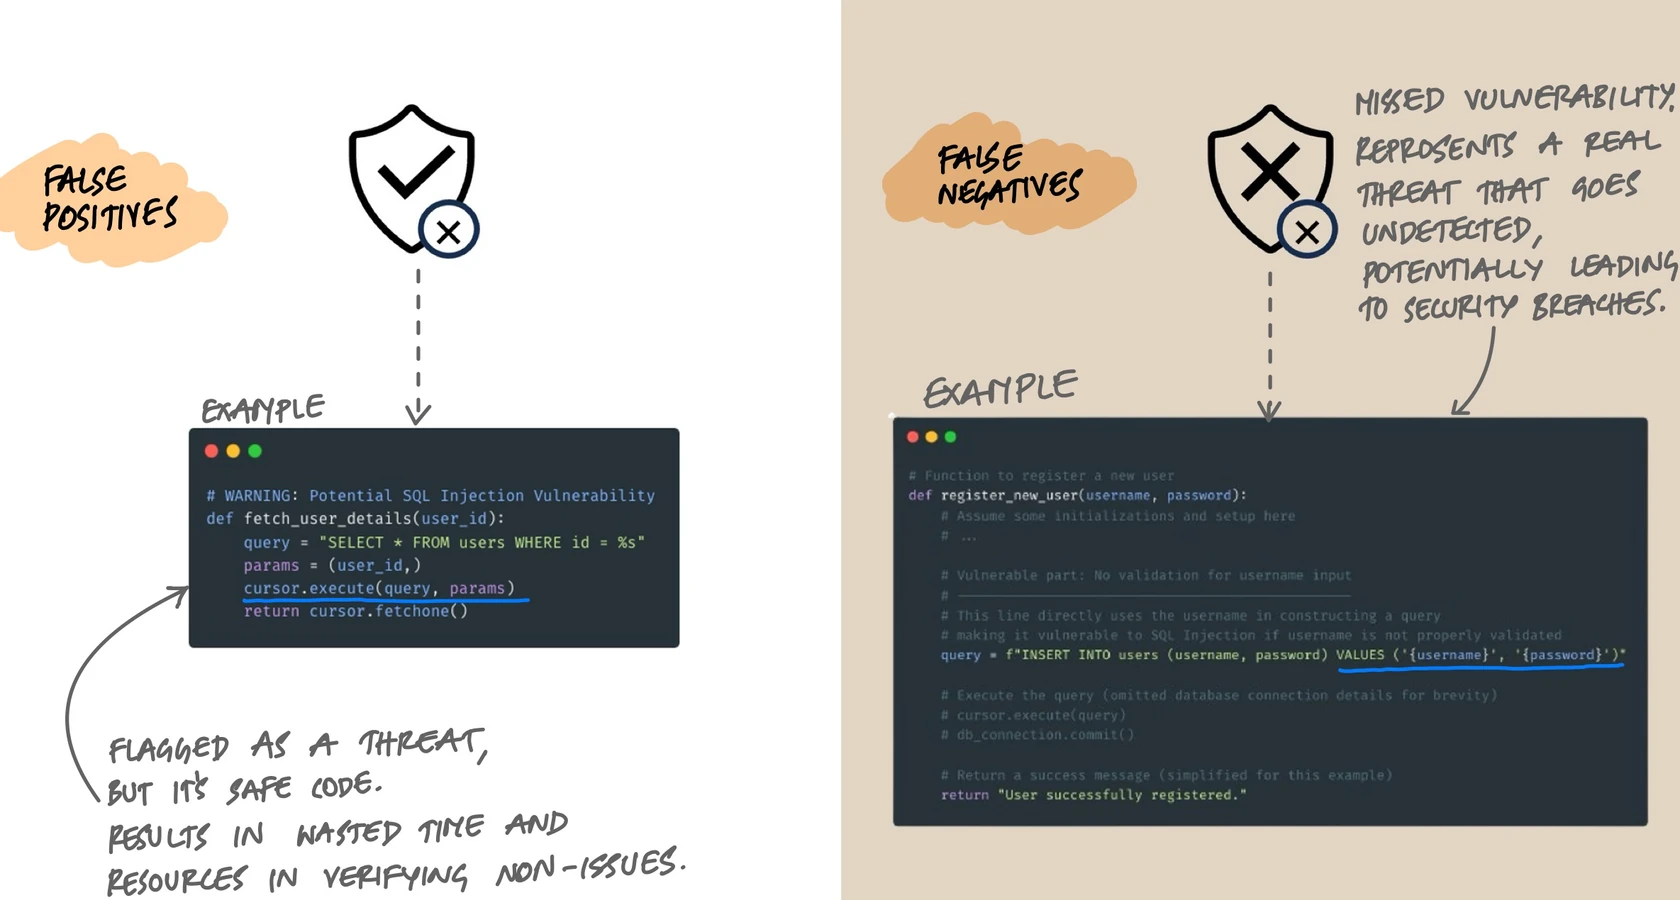
False positives are findings that look like vulnerabilities but aren't. A classic example: the tool flags a SQL query as injectable, but the code actually uses parameterized queries with bound values. The tool couldn't trace the data flow deeply enough to see the sanitization. Every false positive costs developer time to investigate and dismiss.
False negatives are real vulnerabilities the tool misses entirely. This happens when the vulnerability pattern doesn't match any rule, or when the data flow is too complex for the tool to follow. String concatenation in a SQL query inside a deeply nested helper function might slip through if the tool doesn't trace across enough call boundaries.
Tools face a fundamental tradeoff between these two. Tighten the rules and you catch more real issues but also generate more false positives. Loosen them and you reduce noise but miss real vulnerabilities. There's no perfect setting - only the right balance for your team and codebase.
Managing the Noise in Practice
Teams that successfully adopt static analysis do a few things differently:
- Start with a narrow rule set. Enable only high-confidence rules initially. Rules for SQL injection, XSS, hardcoded credentials, and known dangerous functions have low false positive rates. Expand gradually.
- Use quality gates on new code only. Don't try to fix 10,000 findings in legacy code on day one. Set the gate to check only code changed in the current PR. This prevents existing debt from blocking all progress while ensuring new code meets the standard.
- Tune aggressively. When a rule consistently produces false positives for your codebase, suppress it or adjust its configuration. A rule that's wrong 90% of the time teaches developers to click "dismiss" without reading.
- Treat findings like tests. A finding that's been triaged and marked as "won't fix" should stay marked. Don't let it resurface in every scan. Most tools support baseline files or inline suppression comments for this.
What Static Analysis Catches Well (and What It Doesn't)
Understanding the strengths and blind spots helps set realistic expectations.
Catches Well
- Injection flaws. SQL injection, XSS, command injection, LDAP injection - any pattern where untrusted data reaches a sensitive sink without sanitization.
- Buffer overflows. Particularly in C/C++, tools can detect unsafe memory operations with high confidence.
- Hardcoded secrets. API keys, passwords, tokens embedded in source code.
- Known insecure patterns. Use of deprecated cryptographic algorithms, insecure random number generators, disabled certificate validation.
- Code quality issues. Dead code, excessive complexity, duplicated blocks, unused variables, missing null checks.
Struggles With
- Authentication and authorization logic. A tool can't tell if your role-based access control is correct because "correct" depends on business requirements, not code patterns.
- Configuration issues. Misconfigured CORS headers, overly permissive S3 buckets, or insecure TLS settings live outside the source code.
- Business logic flaws. A checkout flow that allows negative prices, or a rate limiter that doesn't actually limit - these require understanding intent, not just structure.
- Race conditions and concurrency bugs. Some tools attempt this, but the state space is typically too large for reliable static detection.
This is why SAST alone isn't enough. It's one layer in a defense-in-depth approach that includes DAST, manual penetration testing, code review, and runtime monitoring.
Choosing a Tool
The SAST landscape has a wide range of tools, from open-source to enterprise. The right choice depends on your languages, team size, and what you're trying to catch.
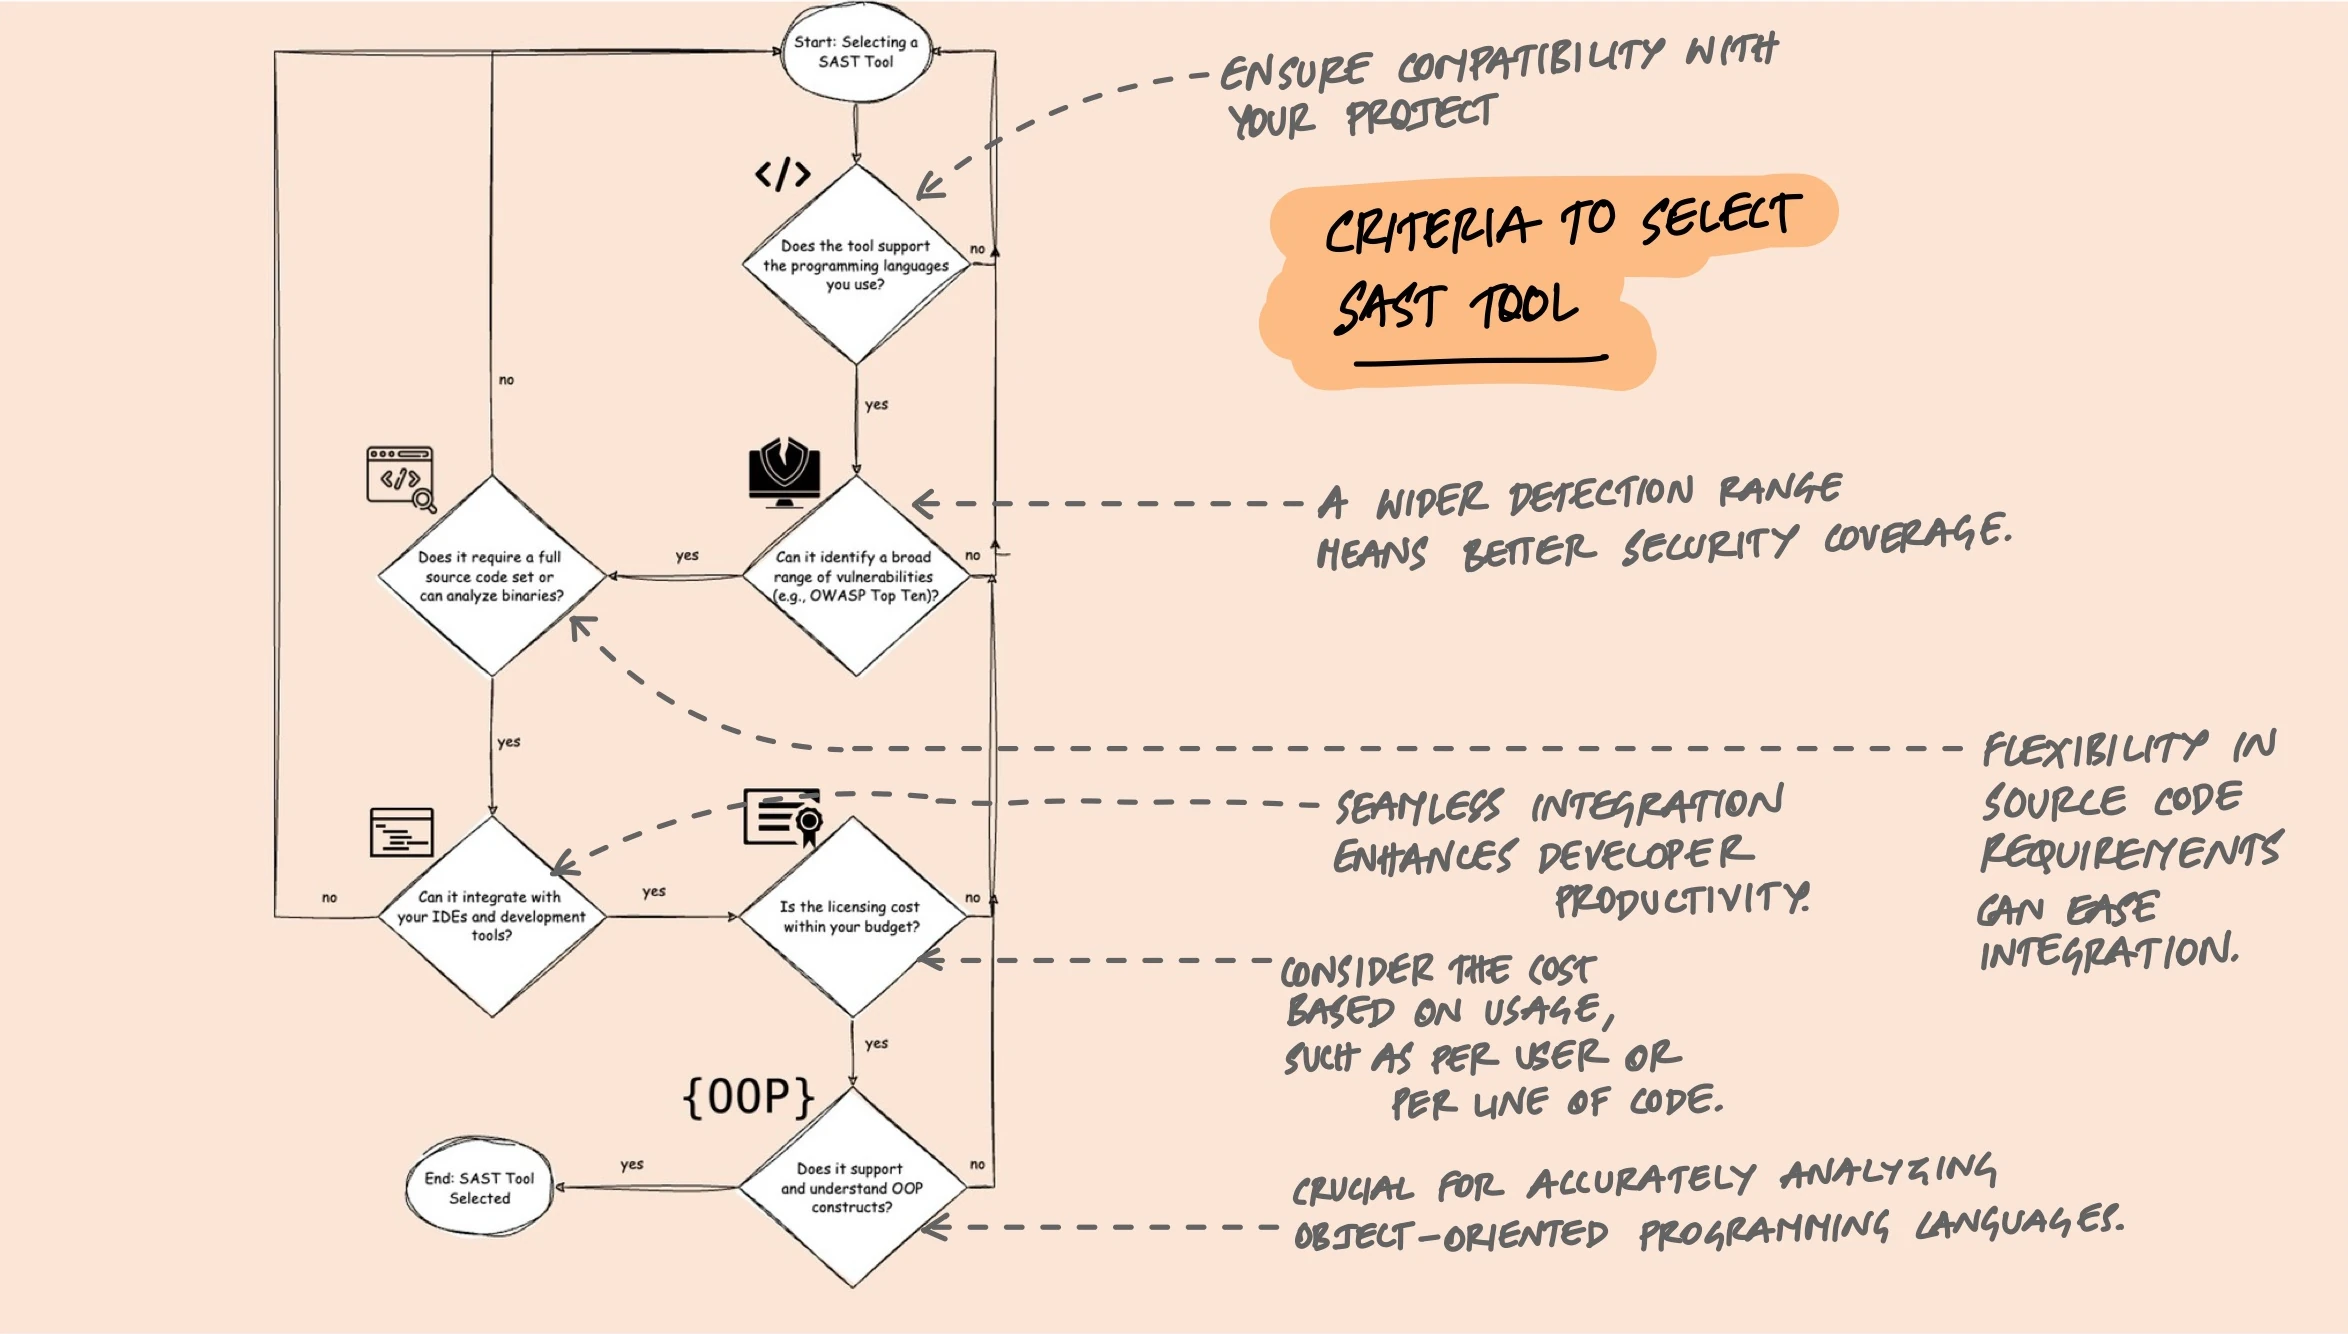
A few practical criteria that matter more than feature comparison charts:
- Language support. The tool must support your stack. A tool that doesn't understand your framework's ORM won't detect SQL injection properly even if it supports the language.
- CI/CD integration. Can it run in your pipeline? Does it support PR comments, quality gates, and incremental analysis? If developers have to go to a separate dashboard to see results, adoption will be low.
- Rule quality over quantity. 5,000 rules means nothing if 4,000 of them produce false positives for your codebase. Look at the quality and tunability of rules, not the count.
- Custom rules. Can you write rules specific to your codebase? If your team has internal security patterns (like a custom sanitization library), you need a tool that lets you encode that knowledge.
- Incremental analysis. Scanning only changed files rather than the entire codebase on every commit is the difference between a 30-second check and a 30-minute one.
Some tools worth evaluating:
- SonarQube / SonarCloud: The most widely adopted open-source option. Strong on code quality metrics (complexity, duplication, test coverage) in addition to security. The Community edition is free; Developer and Enterprise editions add branch analysis and additional language support.
- Semgrep: A lightweight, open-source tool that lets you write custom rules using a pattern syntax that looks like the code you're matching. Fast, easy to adopt, and increasingly popular for security-focused teams.
- CodeQL (GitHub): Treats code as data and lets you write queries against it. Powerful for deep analysis, especially cross-function data flow. Free for public repositories; available through GitHub Advanced Security for private repos.
- Checkmarx, Fortify, Veracode: Enterprise-grade commercial tools with broad language support, compliance reporting, and dedicated support. Higher cost, but often required in regulated industries.
Making It Work in Practice
The technical capabilities of these tools matter less than how you integrate them into your workflow. Here's what I've seen work:
Quality Gates That Actually Gate
A quality gate is a set of conditions that code must meet before it can be merged or deployed. Common gates include:
- No new critical or high-severity security findings
- No reduction in test coverage below a threshold
- No new code with complexity above a configured limit
- All new security hotspots reviewed (not necessarily fixed, but consciously triaged)
The key word is "new." Gating on the overall codebase state in a legacy project is a recipe for the tool being immediately disabled. Gate on the delta - what changed in this PR - and you get continuous improvement without blocking all progress.
Incremental Adoption
Rolling out static analysis to an existing codebase follows a predictable path:
- Baseline the existing findings. Run a full scan and mark all current findings as the baseline. This doesn't mean you accept them - it means you separate "existing debt" from "new issues."
- Enable gates on new code. From this point, every PR must pass the quality gate. New findings get addressed before merge.
- Gradually reduce the baseline. Allocate time each sprint to address existing findings, prioritizing by severity. Some teams dedicate a percentage of each sprint; others do focused "quality sprints" periodically.
- Expand the rule set. As the team gets comfortable, enable additional rules. Add custom rules for patterns specific to your codebase.
Developer Experience Matters
The fastest way to kill static analysis adoption is to make it a burden. A few things that help:
- Fast feedback. If the scan takes 20 minutes, developers will context-switch and lose focus. Incremental analysis that runs in seconds keeps the feedback loop tight.
- Clear findings. A finding that says "potential SQL injection at line 47" with a link to the code and a remediation example is actionable. A finding that says "CWE-89 detected" with no context isn't.
- IDE integration. Catching issues before commit is faster and less disruptive than catching them in CI. Tools like SonarLint and Semgrep have IDE plugins that provide real-time feedback.
- Suppression mechanisms. Developers need a way to mark false positives without filing a ticket. Inline comments (
// NOSONAR,// nosemgrep) with a required justification strike the right balance between control and convenience.
Key Takeaway
Static analysis is not about achieving zero findings. It's about building a feedback loop that catches the bugs humans miss, consistently and automatically. The tools aren't perfect - they produce false positives, miss certain classes of bugs, and require tuning. But a well-configured static analysis pipeline running on every PR, with quality gates that focus on new code, catches real vulnerabilities before they reach production. Start narrow, tune aggressively, and expand gradually. The goal isn't perfection - it's continuous improvement.