Crafting Actionable IT Alerts: A Developer's Guide to Effective Monitoring

There's a pattern I've seen on almost every team I've worked with. The monitoring setup looks impressive - dashboards everywhere, hundreds of alert rules, Slack channels buzzing with notifications. But when something actually breaks, the person on call either doesn't notice (because they've learned to ignore the noise) or gets paged for something that doesn't matter (because the alerts don't distinguish between a minor blip and a real outage). The alert system is loud, but not useful.
A good starting point for thinking about this problem is Rob Ewaschuk's My Philosophy on Alerting, written from his experience as a Site Reliability Engineer at Google. His core idea is deceptively simple: every alert should require urgency and intelligence. If it doesn't need both, it shouldn't be waking someone up. This post builds on that foundation, combined with what I've picked up from Google's SRE handbook and from working with alerting systems in practice.
Why Most Alerting Systems Fail
Here's a scenario that happens more often than anyone admits. A team sets up monitoring for the first time. They're thorough - they add alerts for CPU usage, memory, disk space, database connections, queue depth, error rates, latency, and a dozen other metrics. In the first week, the on-call engineer gets 50 alerts. Most of them turn out to be nothing - a brief CPU spike that resolved itself, a disk usage threshold set too low, a transient network blip that the retry logic already handled.
By the third week, the engineer has learned to glance at alerts and dismiss them. By the second month, alerts go unacknowledged for hours. Then one night, a real outage happens. The alert fires - but it looks exactly like the dozens of false alarms that came before it. The engineer sees it, assumes it's another false positive, and goes back to sleep. Users are down for two hours before anyone reacts.
This is alert fatigue, and it's the single biggest failure mode in monitoring. The irony is that the team with 200 alert rules is often less prepared for real incidents than the team with 10 carefully chosen ones. More alerts don't mean better coverage - they mean more noise.
Every time my pager goes off, I should be able to react with a sense of urgency. I can only react with a sense of urgency a few times a day before I become fatigued.
Here's the counterintuitive part: over-monitoring is a harder problem to solve than under-monitoring. Too few alerts means you might miss something. Too many alerts means you will miss something - because your team has stopped trusting the system.
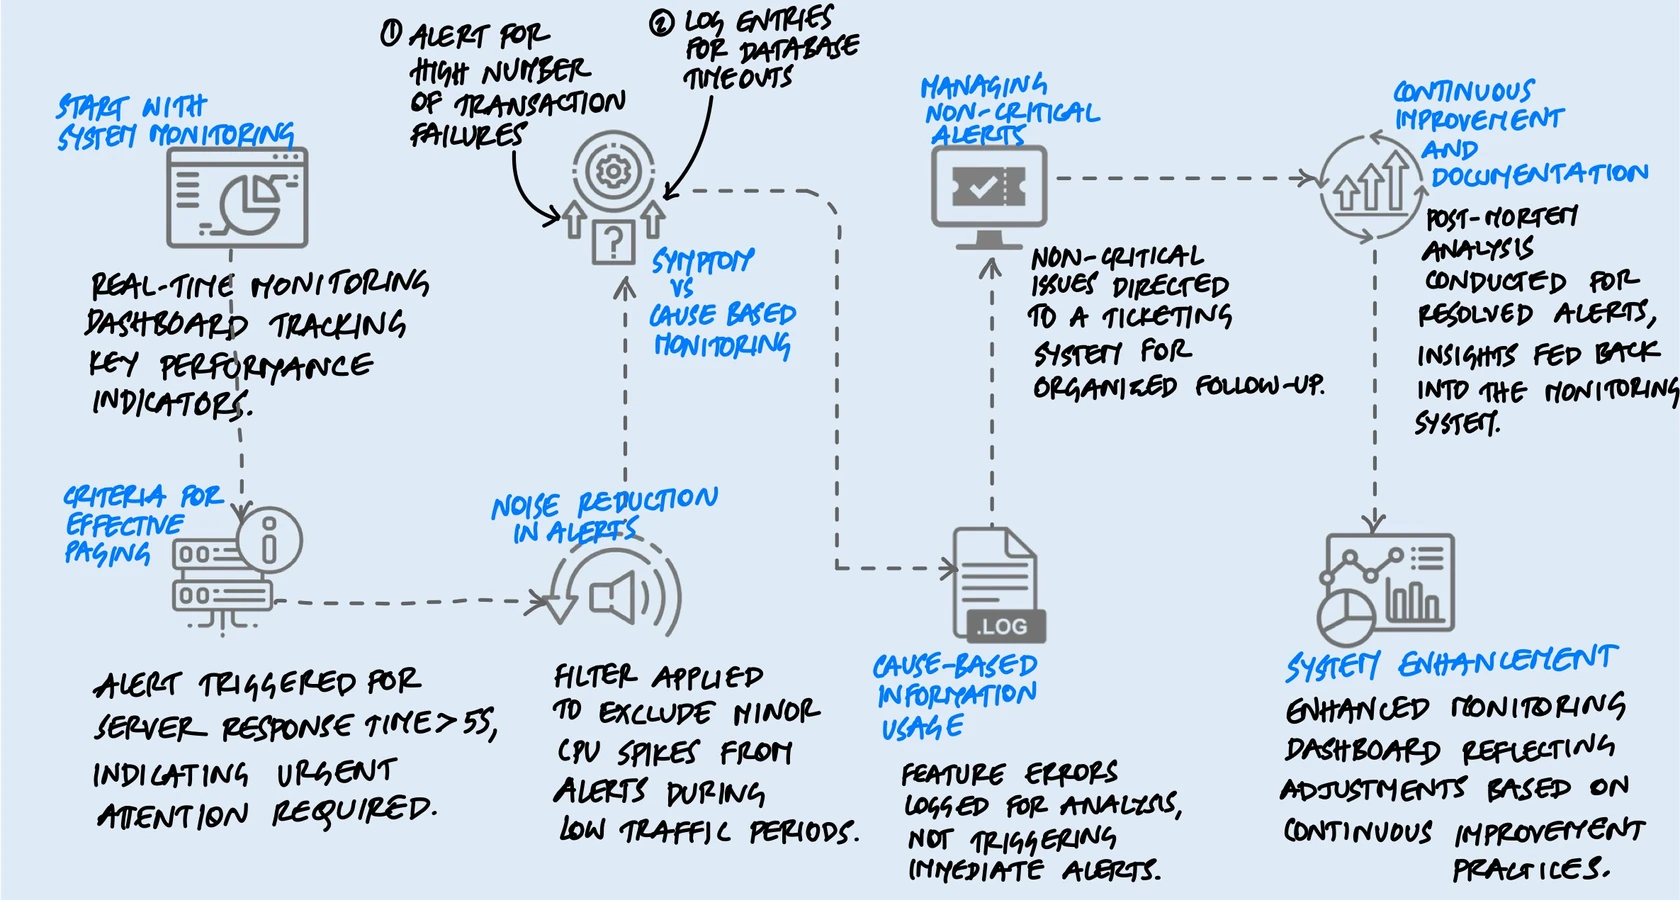
Symptoms Over Causes
This is the single most useful mental shift I've come across when it comes to alerting, and once you internalize it, it changes how you think about every alert you write.
Most teams alert on causes: the database is slow, a server's CPU is at 90%, a pod restarted, a connection pool is exhausted. These feel like the right things to monitor because they're specific and technical. But here's the problem - causes don't always lead to user impact. A database might be slow, but if the application has a cache layer in front of it, users might not notice at all. A pod might restart, but if there are five other healthy pods behind a load balancer, traffic continues to flow. You've just woken someone up at 3 AM for a non-event.
Symptoms, on the other hand, are what users actually experience: the site is returning errors, pages are loading slowly, transactions are failing, data is stale. When you alert on symptoms, you're guaranteed that the problem is real and that someone is affected.
Think about it this way. If your database goes down and you have cause-based alerting, you get a page that says "Database connection refused." That's useful, but what if the same database failure also triggers alerts for the cache miss rate, the queue depth, the API latency, and three different health checks? Now you're looking at six alerts for one problem, trying to figure out which one is the root cause while your phone won't stop buzzing.
With symptom-based alerting, you get one alert: "Error rate on the checkout API exceeded 5% for the last 10 minutes." That's it. One alert that tells you users are affected, and the cause-based metrics are right there on your dashboard when you go to investigate. The difference between six frantic pages and one calm, informative one is the difference between chaos and control.
Symptoms are a better way to capture more problems more comprehensively and robustly with less effort. Include cause-based information in symptom-based pages or on dashboards, but avoid alerting directly on causes.
This doesn't mean you throw away cause-based monitoring. You still track CPU, memory, disk, connections - all of it. You just don't page on them. They live on dashboards and in logs, where they're invaluable for debugging. The distinction is between what wakes you up and what helps you investigate once you're awake.
The Four Golden Signals
Google's SRE team distilled decades of monitoring experience into four metrics that matter most for any user-facing system. If you only monitor four things, monitor these:
Latency
How long requests take to complete. But there's a subtlety that many teams miss: you need to track latency for successful requests and failed requests separately. A request that fails fast (returning an error in 10ms) can drag down your average latency and make it look like things are getting faster - when actually your service is broken. Slow errors are especially important to track, because they tie up resources and indicate something is struggling rather than just failing cleanly.
Traffic
How much demand is hitting your system, measured in whatever unit makes sense for your service - HTTP requests per second, concurrent sessions, messages processed per minute, transactions per hour. Traffic tells you the context for everything else. High latency during a traffic spike means something very different from high latency during a quiet period.
Errors
The rate of requests that fail. This includes the obvious ones (HTTP 500s, exceptions, crashes) but also the subtle ones - requests that return HTTP 200 but with wrong data, or responses that violate your SLA even though they technically "succeeded." Some of the worst bugs hide behind a 200 status code.
Saturation
How full your system is. This is the most forward-looking of the four signals, because performance typically degrades well before you hit 100% utilization. A database at 80% connection capacity might still be responding fine, but you're one traffic spike away from trouble. Saturation alerts are one of the few places where cause-based alerting makes sense - "disk 90% full and growing" is worth a page even if users aren't affected yet, because by the time they are, it's too late.
What a Good Alert Actually Looks Like
Beyond the principles, there are practical details that make a real difference when someone is staring at their phone at 3 AM trying to figure out what's happening.
The Alert Message Itself
A surprising number of alerts just say something like "Server Down" or "High CPU." That tells you almost nothing. Compare these two:
- Bad: "Database alert triggered."
- Good: "Checkout API error rate at 8.2% (threshold: 5%) for the last 15 minutes. 340 users affected. Dashboard: [link]. Playbook: [link]."
The second alert tells you what's broken, how bad it is, how long it's been happening, who's affected, and where to go next. The on-call engineer can start making decisions immediately instead of spending the first ten minutes just figuring out what the alert is about. A good alert message should answer three questions at a glance: what is happening, how bad is it, and where do I start.
Thresholds: Static vs. Dynamic
Static thresholds ("alert if CPU exceeds 80%") are easy to set up but often wrong. What's normal at 2 PM during peak traffic is not normal at 3 AM. A service that handles 10,000 requests per second during the day might drop to 500 at night - a static error rate threshold that's reasonable during the day could fire constantly at night when a handful of errors look like a high percentage.
Dynamic thresholds compare current behavior to what's normal for that time of day and day of week. They're harder to set up but dramatically reduce false positives. If you can't do full dynamic thresholds, even simple adjustments help - different thresholds for business hours vs. off-hours, or alerting on the rate of change rather than the absolute value.
Tiering Your Responses
Not every problem needs a human at 3 AM. I think of it as three tiers:
- Pages are for urgent, user-affecting problems that need immediate human intervention. Your checkout is down, your data pipeline is corrupted, your service is returning errors to customers. These are "drop everything" situations.
- Tickets are for problems that need to be fixed soon but not right now. A certificate expiring in two weeks, a gradually filling disk, a degraded but functioning redundancy setup. These go into a ticketing system with an owner and a deadline.
- Logs and dashboards are for everything else. Informational data that helps with debugging and capacity planning but doesn't need anyone's attention until they're actively investigating something.
The mistake most teams make is putting everything in the first tier. When you have a clear tiering system, the pages that do fire carry real weight. The on-call engineer knows that if their phone buzzes, it's real and it's urgent. That trust is what makes the whole system work.
Beyond the Basics
The principles above will get you most of the way. But there are a few more things I've found matter in practice.
Use SLOs to Drive Alerts
Instead of picking arbitrary thresholds, define Service Level Objectives (SLOs) for your system - for example, "99.9% of requests should complete in under 500ms" or "error rate should stay below 0.1%." Then set up an error budget: the amount of failure your SLO allows over a given window. Alert when you're burning through your error budget faster than expected.
What makes this work is that it automatically adjusts for context. A brief spike in errors during a low-traffic period barely dents the budget and won't page anyone. The same spike during peak traffic burns through the budget fast and triggers an alert. You're not alerting on "something looks wrong" - you're alerting on "we're on track to break our promise to users."
Test Your Alerts
This sounds obvious but almost nobody does it. When was the last time you verified that your critical alerts actually fire when the condition they're monitoring occurs? Alerts can silently break - a config change, a metric rename, a monitoring service upgrade - and you won't know until the incident happens and the alert doesn't.
Some teams run periodic "fire drills" where they intentionally trigger alert conditions in a staging environment and verify the full chain: the alert fires, the notification reaches the right person, the playbook link works, and the dashboard shows the right data. It's a small investment that catches a surprising number of silent failures.
The "What Changed?" Question
When an alert fires, the first question the on-call engineer asks is almost always: "What changed?" Was there a deployment? A config change? A traffic pattern shift? An upstream dependency issue? If your alerting system can surface recent changes alongside the alert - the last deployment timestamp, recent config diffs, traffic graphs - it cuts investigation time dramatically. The fastest way to find the cause of an incident is usually to find the most recent change.
Keep Playbooks Short and Honest
Every alert should have a linked playbook that explains: what this alert means, what the likely causes are, and what steps to take first. But keep them focused. A playbook that's 20 pages long with elaborate flowcharts won't get read at 3 AM. A few paragraphs with the most common causes and their fixes will.
And be honest in your playbooks. If the usual response to an alert is "restart the service and file a ticket to investigate later," write that down. Pretending every alert requires deep root-cause analysis in the moment just leads to engineers spending an hour debugging something that a restart would have fixed in two minutes.
Maintaining the System
Good alerting isn't something you set up once and forget. It needs regular maintenance, just like the systems it monitors.
Track Alert Accuracy
One practical habit is tracking how often each alert rule fires and whether it led to meaningful action. If an alert consistently fires without requiring intervention - below 50% accuracy - it should be demoted to a ticket or removed entirely. This sounds aggressive, but it's based on a simple insight: a noisy alert that's sometimes useful does more harm than good, because it trains people to ignore the alerting system as a whole.
Run Post-Incident Reviews
After every real incident, ask two questions about your alerts: Did we get paged quickly enough? And did we get paged for the right thing? Sometimes you'll find that you were paged for a downstream symptom instead of the primary one, adding confusion during the incident. Sometimes you'll find a gap - a failure mode that had no alert at all. These reviews are how the alerting system improves over time.
Prune Ruthlessly
Google's SRE team explicitly recommends removing signals that are collected but never displayed, dashboards that are never looked at, and alert rules that are never acted on. Monitoring systems accumulate cruft just like codebases do. The discipline of regularly removing what's not useful keeps the system focused and trustworthy.
Rules that detect real incidents most of the time should be simple, predictable, and reliable.
Key Takeaway
The best monitoring systems aren't the ones with the most alerts. They're the ones where every alert means something. When the pager goes off, the on-call engineer trusts it - they know it's real, it's urgent, and there's something they can do about it. That trust is built by being disciplined about what gets to page and what doesn't.
If I had to distill this into one sentence: alert on what users experience, not on what your infrastructure is doing. Put symptoms on the pager, put causes on the dashboard, and put everything else in a ticket. Back it up with SLOs so your thresholds mean something, test your alerts so you know they work, and review regularly so the system stays sharp.
Start by auditing your current alerts. How many of them fired in the last month? How many required action? If the ratio is low, you don't have a monitoring problem - you have a noise problem. Fix that, and your team will respond faster, sleep better, and trust the system that's supposed to be helping them.
A note: Things have changed a lot since I first wrote this. We now have agentic capabilities that can fundamentally change how alerting and incident response work - AI that can investigate alerts, correlate signals, and even take initial remediation steps autonomously. I'm experimenting with some of these in my organisation, and once I have enough evidence and useful recommendations, I'll update this post. That said, I believe the core concepts discussed here - symptoms over causes, signal over noise, trust in the system - remain just as relevant. The tools are changing, but the principles hold.