Simplifying Application Logging

Earlier, most applications managed their own log files. Each service decided where to write, how to rotate, and when to clean up old logs. This worked when you had one server running one application. But when teams started deploying to containers, scaling to multiple instances, and running across distributed systems, the approach fell apart. Log files were scattered across machines, lost when containers restarted, and impossible to search across services. The 12-factor methodology introduced a cleaner rule: your application should treat logs as event streams and write them to stdout. Nothing more.
The Rule: Logs Are Streams
A log is a time-ordered sequence of events. Every time something happens in your application - a request arrives, a query runs, an error occurs - that is an event. The 12-factor principle says your application should write each event as a line to standard output (stdout). That is it. No file paths, no rotation logic, no log management code inside your application.
The application does not know and should not care where its logs end up. In development, they scroll in your terminal. In production, the execution environment captures them and routes them wherever they need to go. The application just writes. Everything else is someone else's job.
What Goes Wrong When Applications Manage Their Own Logs
Here is a pattern that looks reasonable but causes real problems at scale:
import logging

# Application manages its own log file
handler = logging.FileHandler("/var/log/myapp/app.log")
handler.setFormatter(logging.Formatter(
    "%(asctime)s %(levelname)s %(message)s"
))

logger = logging.getLogger("myapp")
logger.addHandler(handler)
logger.setLevel(logging.INFO)

logger.info("Application started")
This writes logs to a file on disk. It seems fine for a single server. But several things break as you scale:
- Containers lose files on restart. When a container stops, its filesystem is gone. All those logs disappear unless you set up volume mounts - which adds complexity that the application should not be responsible for.
- Multiple instances write to different files. If you run three instances of the same service, each writes to its own local file. To debug an issue, you need to SSH into each machine, find the right file, and manually correlate events across them.
- Disk fills up silently. Without rotation, log files grow until the disk is full. The application either crashes or starts dropping logs. Now your logging code needs rotation logic, retention policies, and error handling - none of which is the application's job.
- File paths differ between environments.
/var/log/myapp/might exist on your production server but not in your local Docker container. Now the application needs environment-specific configuration just for logging, which violates the principle of keeping code identical across environments.
The Right Way: Write to Stdout
The fix is simple. Instead of a FileHandler, use a StreamHandler that writes to stdout:
import logging
import sys

# Application writes to stdout - nothing else
handler = logging.StreamHandler(sys.stdout)
handler.setFormatter(logging.Formatter(
    "%(asctime)s %(levelname)s %(message)s"
))

logger = logging.getLogger("myapp")
logger.addHandler(handler)
logger.setLevel(logging.INFO)

logger.info("Application started")
# Output: 2025-01-29 10:15:32,041 INFO Application started
The application code is nearly identical. The only change is where the logs go. But this one change makes the application work the same way everywhere - on a developer's laptop, in a Docker container, on a Kubernetes pod, or on a bare-metal server. No file paths to configure. No directories to create. No rotation to manage.
Why Stdout? Because the Environment Decides
The key insight is that routing logs is an infrastructure concern, not an application concern. Where logs go depends on where the application is running, and the application should not know or care about that.
In local development, logs appear directly in the terminal. You see them as they happen. No setup needed.
In Docker, the container runtime captures everything written to stdout. You read it with docker logs:
# View logs from a running container
docker logs myapp-container

# Follow logs in real-time
docker logs -f myapp-container

# Show only the last 100 lines
docker logs --tail 100 myapp-container
In Kubernetes, the same stdout output is available through kubectl logs. If the pod crashes and restarts, you can still access the previous container's logs:
# View current pod logs
kubectl logs myapp-pod

# View logs from the previous crashed container
kubectl logs myapp-pod --previous

# Follow logs across all pods with a label
kubectl logs -f -l app=myapp
In production at scale, a log collector like Fluentd or Filebeat picks up stdout from every container and ships it to a centralized system like Elasticsearch, Splunk, or CloudWatch. The application never changed. Only the environment around it did.
Structured Logging: Making Logs Machine-Readable
Writing to stdout is the first step. The second step is making your logs useful at scale. Plain text logs like Application started are fine for reading in a terminal, but they are hard to filter, search, and aggregate when you have thousands of log lines per second across dozens of services.
Structured logging means writing each event as a JSON object instead of a plain string. Every field becomes searchable and filterable:
import logging
import json
import sys
from datetime import datetime, timezone

class JsonFormatter(logging.Formatter):
    def format(self, record):
        return json.dumps({
            "timestamp": datetime.now(timezone.utc).isoformat(),
            "level": record.levelname,
            "message": record.getMessage(),
            "logger": record.name,
            "module": record.module,
        })

handler = logging.StreamHandler(sys.stdout)
handler.setFormatter(JsonFormatter())

logger = logging.getLogger("myapp")
logger.addHandler(handler)
logger.setLevel(logging.INFO)

logger.info("User logged in")
This produces output like:
{
  "timestamp": "2025-01-29T10:15:32.041Z",
  "level": "INFO",
  "message": "User logged in",
  "logger": "myapp",
  "module": "auth"
}
Now a log aggregation tool can index every field. You can query for all ERROR level events, or all events from the auth module, or all events in the last five minutes. You can add custom fields like user_id, request_id, or duration_ms to make debugging even easier.
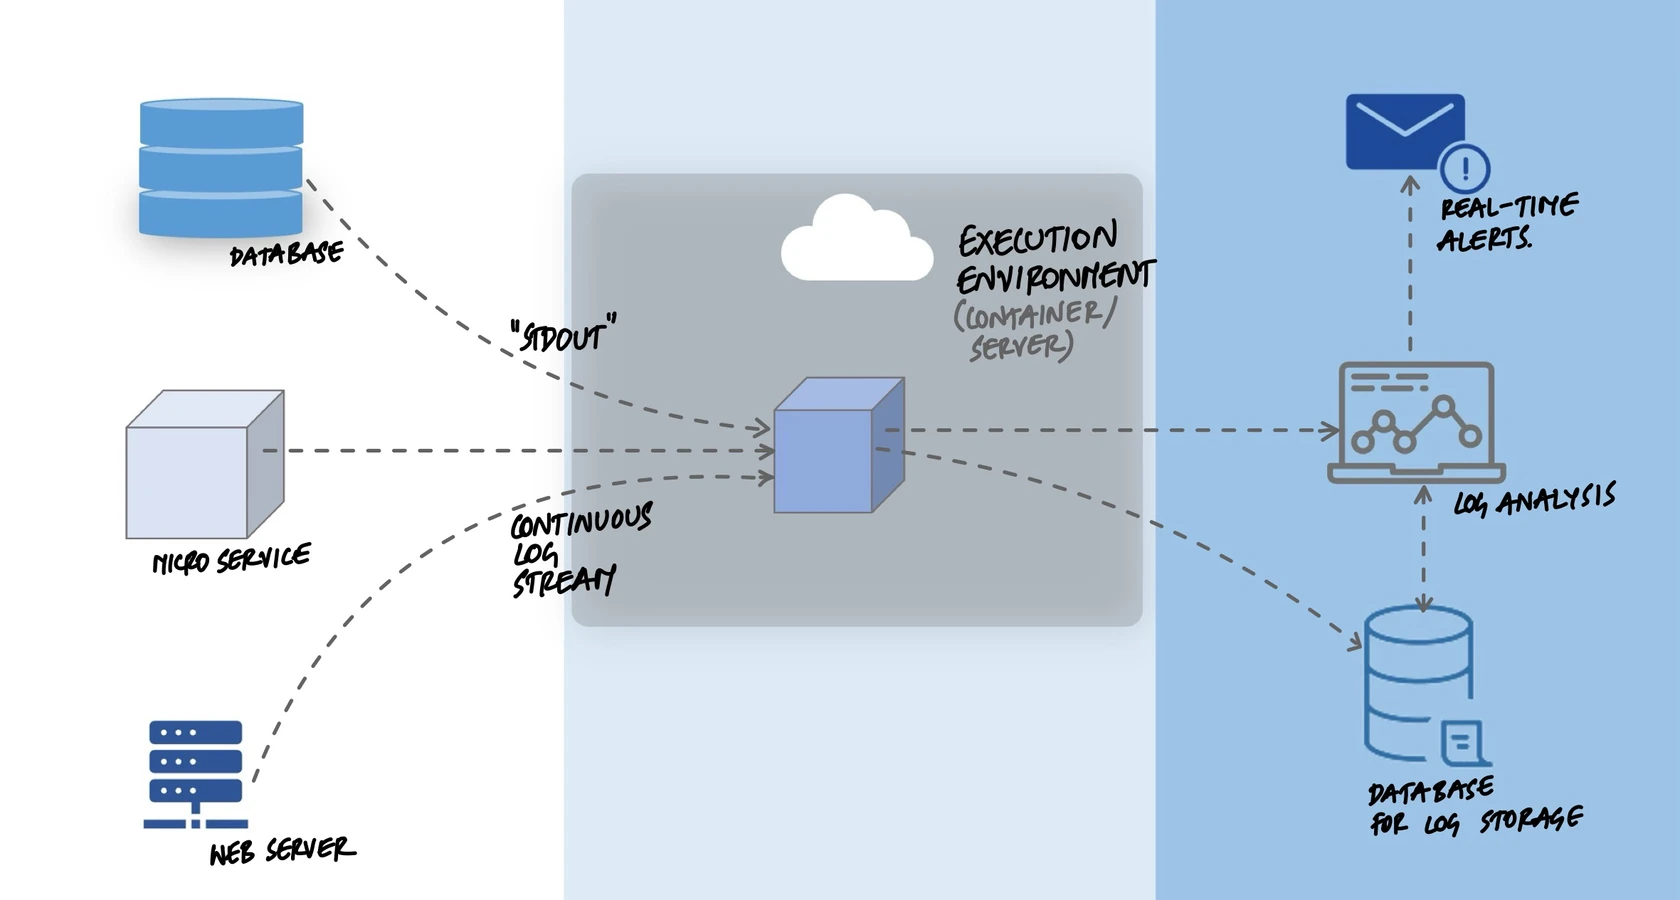
The Log Aggregation Pipeline
When your application writes to stdout, the environment handles everything else. A typical production pipeline looks like this:
- Application writes to stdout. Each process produces a stream of log events.
- Container runtime captures the stream. Docker or Kubernetes stores the output in temporary files on the node.
- Log collector picks up the files. A tool like Fluentd, Filebeat, or the CloudWatch agent runs on each node and reads the captured output.
- Collector ships logs to a central store. The logs are sent to Elasticsearch, Splunk, Datadog, CloudWatch, or whatever the team uses for observability.
- Teams search, alert, and build dashboards. Centralized logs make it possible to trace a request across services, set up alerts for error spikes, and visualize trends.
The application knows nothing about this pipeline. It writes to stdout. The pipeline can be changed - switching from Elasticsearch to Splunk, or adding a new alerting tool - without touching any application code.
Adding Context: Request Tracing
In a distributed system, a single user action can trigger requests across multiple services. Without a way to connect the dots, you end up searching through millions of log lines trying to find the ones related to a specific problem.
The solution is to include a request_id in every log event. When a request enters the system, generate a unique ID and pass it through every service call. Every log line includes that ID:
import uuid

def handle_request(request):
    request_id = request.headers.get(
        "X-Request-ID",
        str(uuid.uuid4())
    )

    logger.info("Request received", extra={
        "request_id": request_id,
        "method": request.method,
        "path": request.path,
    })

    # Pass request_id to downstream service calls
    response = call_payment_service(
        order_id=order.id,
        headers={"X-Request-ID": request_id}
    )

    logger.info("Request completed", extra={
        "request_id": request_id,
        "status": response.status_code,
    })
Now, to debug an issue for a specific request, you search your log aggregation tool for that single request_id. Every event from every service that touched that request shows up, in order. Instead of guessing which log lines are related, you see the full picture in seconds.
What Not to Log
Logging everything is tempting but counterproductive. Too many logs create noise that makes it harder to find real problems. Some guidelines:
- Do not log sensitive data. Passwords, tokens, credit card numbers, and personal identifiers should never appear in logs. Once they are in your log aggregation system, they are searchable by anyone with access.
- Do not log on every iteration of a loop. If your application processes 10,000 records, logging each one creates 10,000 nearly identical log lines. Log the start, the end, and any errors in between.
- Do not use logs for metrics. If you need to track request count or response time, use a metrics system like Prometheus. Logs are for events. Metrics are for measurements.
Key Takeaway
Your application should write logs to stdout as a stream of events. It should not manage log files, decide where logs go, or implement rotation. The execution environment - whether Docker, Kubernetes, or a cloud platform - captures that stream and routes it to the right place. This keeps the application simple, makes it work the same way in every environment, and lets the infrastructure team change the log pipeline without touching application code. Write structured JSON to stdout. Let everything else be someone else's problem.